Put data to work to inform your decision-making
“Don’t rely on luck” – This is the mantra of Ben Lerer, founder of Thrillist, the wildly popular online media site that covers local food, drink, travel, and entertainment across the country. Ben is known for insisting that no one in his company relies on luck for success.
Take it from Ben – one of the worst decisions you can make as a marketer is to leave your results up to chance. While there’s no way to fully control the outcome of your investments, you should arm yourself with every available tool to make sure you’re making informed, strategic decisions.
Listening to your raw sales data will not only strengthen your decision-making, but it will also give you the evidence you need to back up your arguments. You may already suspect that social media advertising is what’s behind your company’s success, but without any historical data to back up your hypothesis, you won’t have much to stand on when your boss asks you why you want to bump up the budget.
If you’re not sure where to start, check out the simple three-step approach below and let the data point you in the right direction.
Track and Wait
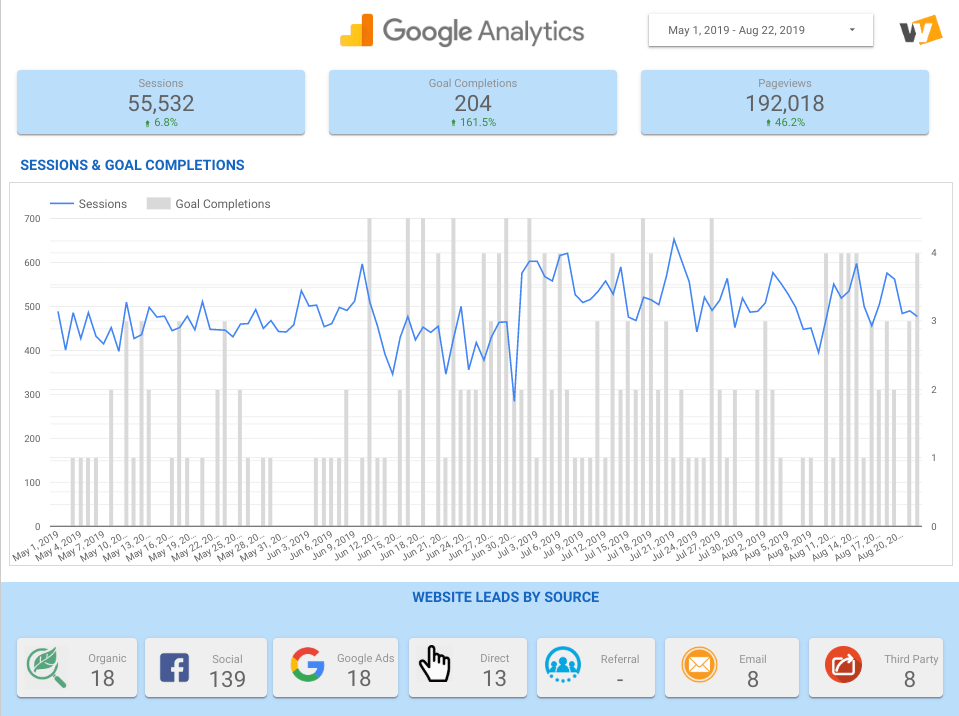
The very first thing you need to do is build a repository of data and let it grow. Start at a point in time and let the data build for at least one month. How the original spreadsheet setup will look depends on where/how you’re investing and what CRM software you use, but generally you’ll want to track leads by channel, sales, marketing spend per channel, etc. Save yourself time down the road by using Google Data Studio from the very beginning of this process. Data Studio will allow you to see the raw data in a compelling, visual way. Not only is it free, but it’s also an incredibly robust tool that allows you to centralize and analyze all the data that you’re collecting with a dashboard that will update in real-timeIt’s compatible with multiple third-party aggregators that you’ll likely already be using to track sales and leads, such as Salesforce, MySQL, and MailChimp, among many others.
The data will automatically update, but you can also filter it by any category that you prefer – date, source, or any other metric that you’re curious about. With the help of Data Studio’s dashboards, you’ll find yourself truly digging into the data and finding nuggets of information to inform your marketing investments.
Follow the numbers
Now that you’ve watched your data grow over time, you can analyze it to identify trends and best practices. This is the most rewarding part – you’ll be able to make sense of the investments you’re making. You may realize that Google ad spend is a goldmine for leads, while your Facebook ads aren’t contributing to any of your success in the slightest. With a click (or two) of your mouse, you’ll be able to clearly see the positives and negatives of your marketing spend.
Play with the tools in Data Studio to compare your results, and don’t hesitate to customize your dashboard moving forward. Test the different charts and graph setups to see which tell the data’s story in the most digestible way. Build even more interactive charts and graphs – I can’t overstate the importance of visualization, especially as you move to the next step and start to use your learnings to inform your decision-making.
Invest wisely, and defend your choices with data
Now that you’ve identified trends, strengths, and weaknesses from your bank of marketing data, you’ll never have to gamble with your budget. You can concentrate on your strongest channels, test your hypotheses, shift strategies and refocus – all with the power of data to inform your choices.
With each change, your data will tell a story that will point you in the right direction. All you have to do is listen.
If you find your business is in need of some marketing strategy help, let our digital marketing experts help you!


