
At Wilmington Design, reporting is an important part of how we measure digital marketing success. It helps our team understand what’s working, what needs attention, and where we can make improvements. But with so many charts, percentages, traffic numbers, and conversion rates, you may find yourself wondering which metrics matter most and what they actually mean for your business.
After all, you’re investing in marketing because you want more customers, more sales, or more opportunities for your business. And while the numbers help us measure progress, the real value comes from understanding how those results connect to your business goals.
That’s why our digital marketing team uses reporting as more than just a way to track performance. We use it to identify opportunities, make recommendations, and guide our ongoing marketing efforts. And while some metrics are more important than others, looking at them together helps us make better decisions.
So, let’s walk through some of the information we include in our client reports, why we track it, and what it means for your business.
Website Traffic: Are People Finding Your Business?
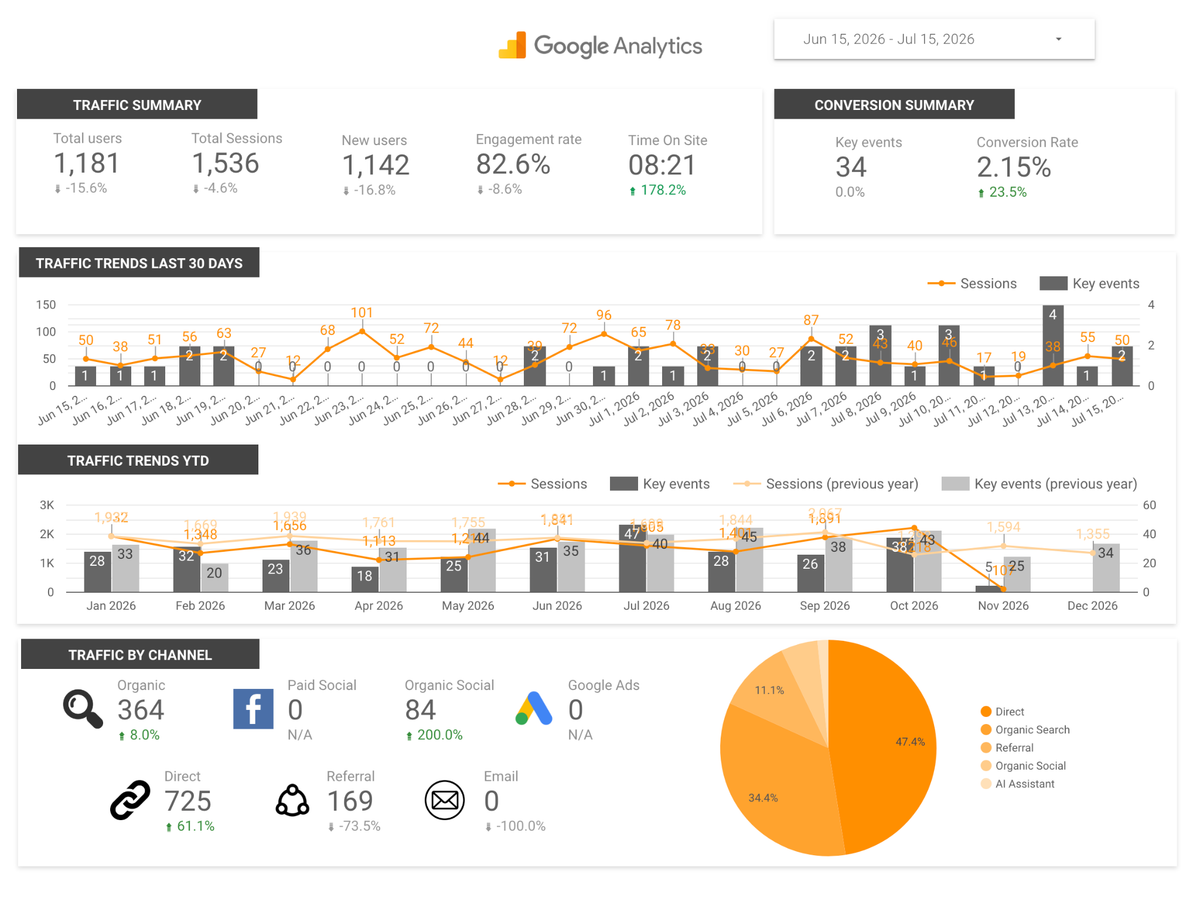
One of the first things you’ll see in your report is an overview of your website traffic. This includes metrics like sessions, users, engagement rates, and where your traffic is coming from. The big question we’re trying to answer is: Are we attracting people to your website, and are they interested in what they find?
Let’s say your website received 3,000 visits last month, up 20% from the previous month. That’s encouraging, especially if we’ve been working on improving your search rankings or running advertising campaigns. But here’s where we look a little deeper.
What if those visitors aren’t spending much time on your website? Or they’re leaving without exploring additional pages or taking any meaningful action? That could mean we’re reaching people who aren’t a good fit, or perhaps the website content isn’t giving them what they’re looking for. On the other hand, it might be perfectly normal for the type of campaign we’re running.
We also look at where your visitors are coming from. Are they finding you through Google searches? Clicking on paid ads? Visiting from Facebook or Instagram? Understanding these traffic sources helps us see which marketing efforts are bringing people to your website and how those visitors behave once they arrive.
Conversions: What Are Visitors Actually Doing?
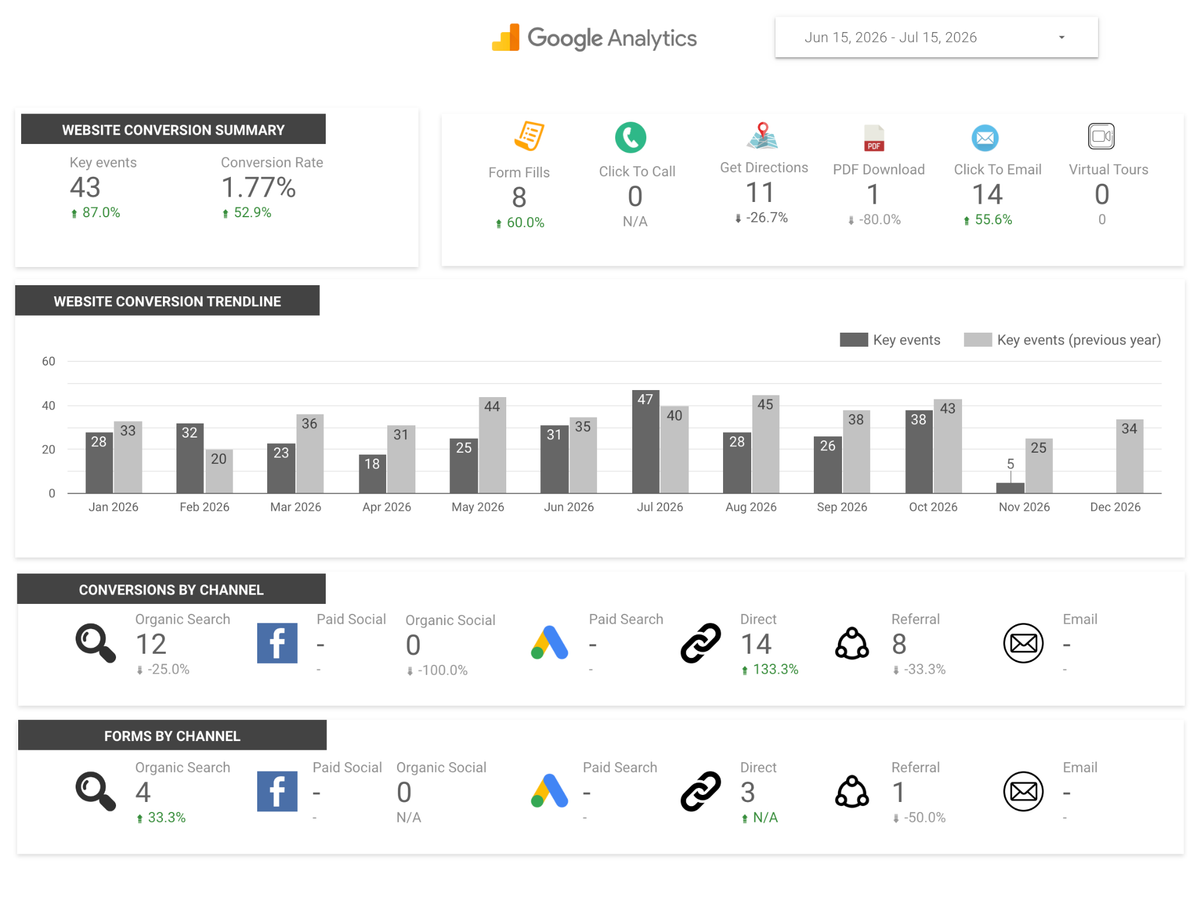
This is where things start getting particularly interesting. Getting someone to visit your website is one thing. Getting them to take action is another. In marketing, we call these actions conversions, and they’re some of the most important metrics we track.
The obvious ones are phone calls, contact form submissions, appointment requests, or quote inquiries. We refer to these as hard conversions because they represent someone reaching out to your business directly.
But you’ll probably notice other conversions listed in your report that don’t immediately look like leads.
These are soft conversions, and they might include:
- Downloading a brochure, floor plan, or PDF
- Viewing an available home or product listing
- Clicking for directions to your business
- Clicking an email address
- Interacting with other important website content
So why are we tracking something like a PDF download? Because not everyone who visits your website is ready to pick up the phone.
Imagine someone shopping for a new home. They might visit a community website several times, look through available floor plans, download a brochure, and compare amenities before deciding to schedule a tour. If we only tracked phone calls and contact forms, we’d miss much of that activity. Soft conversions help us understand whether visitors are showing interest and moving closer to making a decision. They can also tell us which content is helping people along the way.
We can also feed this data back into advertising platforms like Google Ads to help refine targeting and improve campaign performance. By tracking these early signs of interest, we give the platforms additional information to help identify potential customers, even before they’re ready to reach out.
Of course, we don’t consider a brochure download equal to a qualified sales inquiry. That’s why we break down conversions by type, track changes over time, and look at which marketing channels are producing them.
We also monitor conversion rates to understand what percentage of visitors are taking valuable actions, rather than focusing on total traffic alone.
Website Pages & Audience Insights: What Are People Interested In?
Ever wonder which pages on your website get the most attention? We do, too. And not just because we’re curious. Your report includes information about your most visited pages, which pages are producing conversions, and where your visitors are located. This can tell us quite a bit about what potential customers are looking for.
For example, let’s say you’re an HVAC company. Your air conditioning repair page might receive significantly more traffic than your maintenance page. But the maintenance page might generate a higher percentage of appointment requests. That gives us two different pieces of information. One page is attracting more visitors, while the other is doing a better job encouraging them to take action. We can use that information to make decisions about website improvements, future content, and where to direct advertising traffic.
Location matters, too. If your business serves Wilmington, Leland, and Southport, we want to see whether your website is reaching people in those areas. More importantly, we want to know where your inquiries and other conversions are coming from. You might be getting plenty of traffic from one location but generating more business opportunities from another. That could influence how we approach geographic targeting or allocate advertising budgets.
We also look at device usage and, when available, demographic information. If most of your visitors are using their phones, for instance, we want to make sure it’s easy for them to navigate the site, find information, and contact you.
Paid Advertising: Are We Making Good Use of Your Budget?
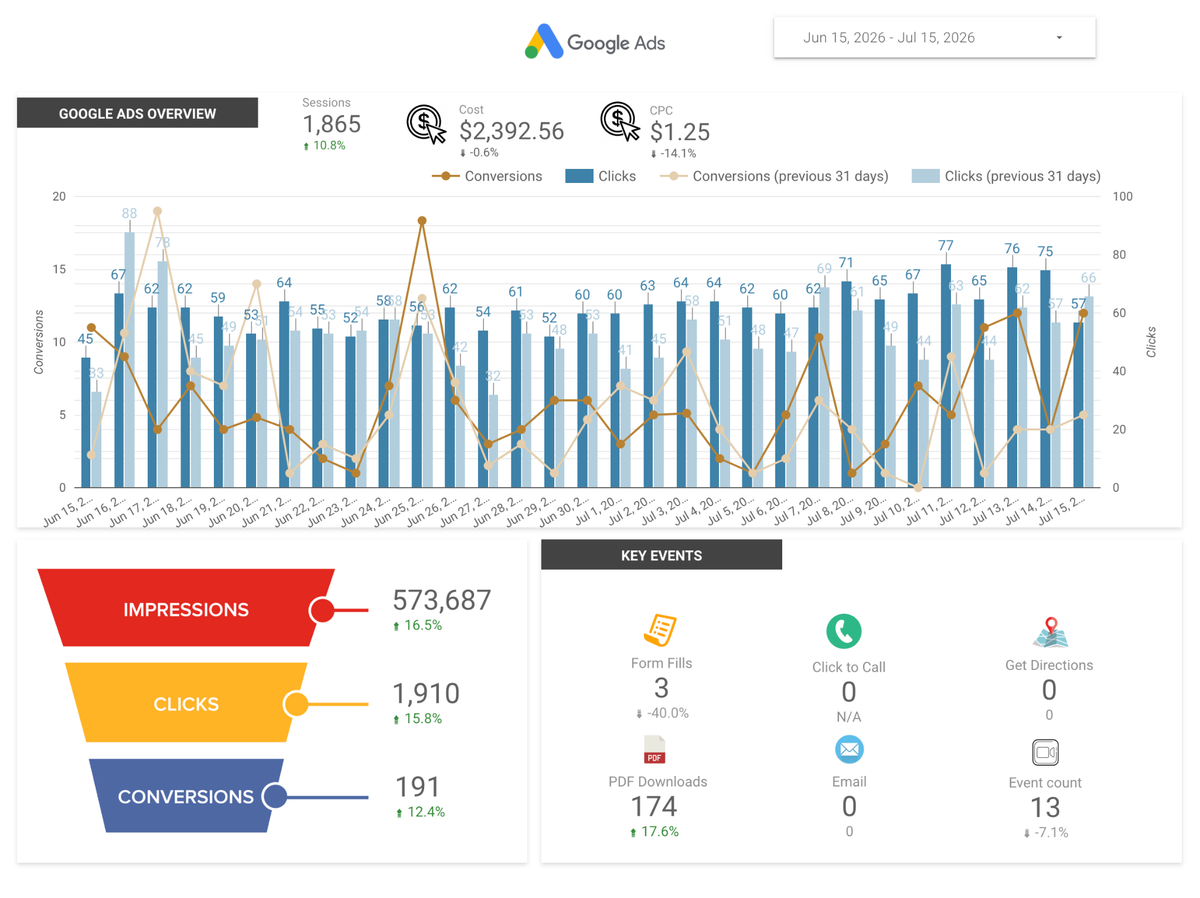
If we’re managing Google Ads, Facebook, Instagram, or other paid advertising campaigns, you’ll see additional sections in your report showing how those campaigns are performing. This is where you’ll encounter metrics like impressions, clicks, click-through rates (CTR), cost per click (CPC), and conversions.
We know that’s a lot of terminology. But the questions we’re asking are pretty straightforward:
- Are people seeing our ads? Impressions help us understand how much exposure the campaigns are getting.
- Are people interested enough to click? Clicks and click-through rates help us evaluate whether our ads are connecting with the audience.
- How much are we paying for that traffic? Cost per click helps us monitor how efficiently we’re spending your advertising budget.
- Are those clicks leading to anything valuable? Conversions help us understand whether the advertising is generating meaningful activity and potential leads.
Here’s an example. Let’s say we’re running two Google Ads campaigns. Campaign A gets 500 clicks at $2 each, while Campaign B gets 200 clicks at $4 each. At first glance, Campaign A looks like the better deal. More clicks for less money. But what if Campaign A generates five inquiries and Campaign B generates 20? Suddenly, Campaign B looks much more promising, even though its clicks cost twice as much. That’s why we don’t judge advertising performance based on cost per click or traffic alone. We want to understand what we’re getting for the money we’re spending.
We also compare results across campaigns, audiences, and time periods to see where we can make improvements. Sometimes that means adjusting budgets, testing different messaging, refining targeting, or changing where an ad sends visitors.
Email Marketing: Is Your Audience Paying Attention?
If email marketing is part of your strategy, we’ll also include information about how your email campaigns are performing. Two of the metrics you’ll commonly see are open rates and click rates.
Open rates give us a general idea of how many recipients opened an email, although email privacy features can make this number less accurate than it used to be. Click rates tell us how many recipients interacted with links in the email. This is often a more useful indicator of whether the content encouraged someone to take the next step.
For example, let’s say we send an email featuring a new home listing. We want to know whether people are clicking through to view the property, and ideally, whether they’re taking additional actions once they get there. That helps us understand which types of content, subject lines, and calls to action are connecting with your audience.
Over time, we can use those insights to improve future campaigns and give subscribers more of the information they’re interested in.
So, What Should You Actually Pay Attention To?
If you’ve made it this far, you might be thinking, “Do I need to keep track of all these numbers every month?” Not necessarily. That’s what we’re here for. Different metrics matter more depending on your business and what we’re trying to accomplish.
If you’re a home builder, we might pay particular attention to floor plan downloads, available home views, and tour requests. If you’re a service business, phone calls and contact form submissions may be your most important conversions.
And if we’re launching a new brand or entering a new market, building awareness and increasing qualified website traffic might be an important early goal.
The important thing is understanding how the numbers relate to your business goals.
We also want to see how things are changing over time. One slow month doesn’t necessarily mean a campaign is failing, just as one great month doesn’t mean we should stop making improvements.
Seasonality, competition, advertising budgets, and customer behavior can all influence performance. Looking at trends helps us understand what’s happening before deciding what to change.
Our reports are customized around the marketing we’re managing and the goals we’ve established with each client. We use that information to explain performance, make recommendations, and guide our ongoing work.
You don’t need to become a Google Analytics expert or spend hours studying charts and percentages. But you should understand what your marketing investment is accomplishing and where we see opportunities to improve.
That’s ultimately what we want our reports to do: help you understand how your marketing is performing and give you confidence in the decisions we’re making together.
Let’s Talk About Your Marketing Goals
Whether you’re investing in SEO, paid advertising, email marketing, or a combination of services, understanding performance is an important part of making your marketing budget work harder.
At Wilmington Design, we help businesses turn marketing data into practical decisions that support their goals.
Let’s talk about your marketing strategy and how we can help you measure what matters.